Diversity in the legal profession
Workforce data for solicitors' firms 2014
May 2014
This is our second report of workforce diversity in solicitors' firms across England and Wales, setting out a profile of the profession in 2013/14.
Introduction
- 1.
This is our second report of workforce diversity in solicitors' firms across England and Wales, setting out a profile of the profession in 2013/14.
- 2.
We hope that many firms will have found the exercise useful and will use their own diversity data to evaluate their approach to equality and diversity. The exercise is an important part of the work that regulated firms are doing in line with Principle 9 to 'encourage equality of opportunity and respect for diversity'.
- 3.
The data will also help us to build a picture of diversity across the profession and will help us in the work we are doing to meet our regulatory objective 'to encourage an independent, strong, diverse and effective legal profession'.
- 4.
We have set out the aggregated data across the whole profession in a series of charts and tables, setting out the diversity characteristics for three groups:
- 'Solicitor Partner or Equivalent' which includes solicitors who are sole practitioners, partners, members or directors.
- 'Solicitor and Other Lawyer' which includes solicitors not in a partner or equivalent role, barristers, chartered legal executives or fellows, licensed conveyancers, patent or trade mark attorneys, costs lawyers and notaries. 57% of those in the 'Solicitor and Other Lawyer' group are solicitors.
- 'Other Staff' which includes all other categories, namely those in other fee earning roles, other managerial roles, IT, HR or other corporate roles.
- 5.
This differs from the breakdown used in 2012 where the charts and tables were split into two groups: Authorised and Non Authorised. The Authorised group used last year is equivalent to first two groups above (Solicitor Partner or Equivalent and Solicitor and Other Lawyer). The Non Authorised group is equivalent to the Other Staff group used this year.
Background
- 6.
The Legal Services Board (LSB) set out its expectations of approved regulators in relation to the collection and publication of workforce diversity data at individual firm level in its decision document 'Increasing diversity and social mobility in the legal workforce: transparency and evidence' published in July 2011.
- 7.
We responded with our proposals for implementing the requirements and for the first year, in 2012, we commissioned Surveylab, a specialist online survey company to carry out a diversity survey on our behalf.
- 8.
In 2013, we expected firms to carry out their own survey and report the aggregated results to us online. through mySRA. We made our new online reporting arrangements available in July 2013 and provided guidance for firms on our website and through a webinar. This was the first year that we introduced the online reporting tool and we have learnt from the feedback received. We are seeking to make some changes to the system and the guidance provided to improve the user experience and will release details of the changes later in the year.
- 9.
The deadline for reporting the diversity data to the SRA was 31 January 2014. We extended the deadline to 25 February 2014, by which time 86% of firms had reported their data to us.
- 10.
After the deadline just over 1,000 firms who had not reported any diversity data were reported to Supervision. The majority of firms are now reporting their diversity data and we will be considering appropriate action for the remaining firms who are found to be non-compliant.
Summary of key findings
- 11.
We have set out high level findings below and more detailed analysis is set out in Appendix 3:
- Age - There are very few individuals aged under 25 in the Solicitor Partner or Equivalent and the Solicitor or Other Lawyer groups (in contrast to the Other Staff group) which is to be expected given the time it takes to complete the training and education requirements to become authorised. Comparing the Solicitor or Other Lawyer group to the Solicitor Partner or Equivalent group shows that many solicitors become partners between the ages of 35 and 44.
- Gender - A higher percentage of Solicitor Partner or Equivalent roles are held by males (69%). More individuals in the other two groups are female, with over 3 times more females in the Other Staff group (77%).
- Disability - There is a similar percentage of individuals reporting themselves as disabled across all three groups (3%).
- Ethnicity - Across all three groups there is a higher proportion of Asian individuals among the Black or Minority Ethnic (BME) categories. There are small differences in the ethnic breakdown between the three groups, the highest proportion of BME individuals is 15% for the Solicitor or Other Lawyer group, as compared to 13% for the Solicitor Partner or Equivalent group and 12% for the Other Staff group.
- Religion or belief - Only 66% of individuals provided details of their religion or belief, this is one of the lowest response rates. The largest religious category for individuals in all three groups is Christian (60% for Solicitor Partner or Equivalent, 56% for Solicitor or Other Lawyer, and 57% for Other Staff). The next largest group are those individuals who have declared themselves to have no religion or to be atheist (25%, 31% and 32% respectively).
- Sexual orientation - 97% of individuals who provided information about their sexual orientation are heterosexual and there was little difference between the three groups.
- School age education - The proportion of individuals attending a UK state school increases from the Solicitor Partner or Equivalent group (62%) to the Solicitor or Other Lawyer group (67%) to the Other Staff group (84%). The proportion attending a UK independent/fee paying school decrease across the role groups (31% to 24% to 9% respectively).
- University education - A much higher proportion of the individuals in the Other Staff group did not attended University (53%), in comparison to the other two groups (5% for Solicitor Partner or Equivalent and 7% for Solicitor or Other Lawyer). Of those individuals who went to University, a higher proportion of individuals in the Solicitor Partner or Equivalent group were part of the first generation of their family to do so (57%), in comparison to the other two groups (45% for Solicitor or Other Lawyer and 22% for Other Staff).
- Primary caring responsibilities for children under 18 - A higher proportion of individuals in the Solicitor Partner or Equivalent group (35%) are primary carers than those in the other two groups (28% for Solicitor or Other Lawyer and 25% for Other Staff). This could be related to the varying age distributions of the role groups.
- Other caring responsibilities - The majority of individuals do not look after, or give any help or support to family members, friends, neighbours or others because of either long-term physical or mental ill-health/ disability or problems related to old age. Where individuals do provide this help or support it is fairly evenly distributed across the role groups.
About the data
- 12.
The data presented in this report is based on the aggregated data that had been entered online by firms (via their mySRA account) as at 14 March 2014.
- 13.
Some headline numbers:
- 9,383 firms provided their information by 14th March 2014
- These firms reported they have a total of 201,203 individuals working for them
- We received information about 159,791 individuals
- On average, firms provided information for about 79% of their staff
- Approximately 39% of the individuals we received information about are solicitors.
- 14.
Our report last year was based on the survey data collected directly from individual questionnaires provided by staff from each firm. As such we were able to calculate the number of individual responses received as a total and per firm. The data this year was based on aggregated data reported by each firm about the responses received from their staff. Firms were asked to confirm how many staff were working at the firm, broken down by 13 role categories. Aggregated data was then entered for each of the survey questions and as there were some individuals who did not respond at all to the questionnaire and some who responded only to some of the questions, it was not easy to identify how many individuals participated in the survey for each firm. In order to calculate the individual response rate per firm and overall, we identified the section with the highest response rate, which was gender, and as we received a total of 159,791 informative responses about gender, we have taken this as the number of responses received.
- 15.
After we started receiving data, we became aware that some firms may not have been clear about how to report the total number of individuals working at a firm as opposed to the total number of respondents to the survey. We suspect that some firms may have entered the total number of survey respondents where we were expecting to see the total number of individuals working for the firm. These firms would show as having a staff response rate of 100%. This may partly explain the increase in the average response rate per firm from 42% in 2012 to 79% in 2013/14 and the 10% reduction in the total number of individuals reported as working for solicitors firms (to 201,203 in 2013/4 from 221,845 in 2012).
- 16.
There was a similar number of firms providing their information as last year (9,408 in 2012) and an increase of more that 58% in the number of individuals responding to the survey (93,074 in 2012).
- 17.
The results in the graphs below are based on the data provided by individuals responding to the diversity survey and are not necessarily indicative of the entire population.
- 18.
The known response rate of the different questions in the diversity survey varied from 65% responding to the question about university education to 79% responding to the gender question. A 'known response' is where an individual has selected one of the diversity categories provided, not including 'prefer not to say'.
- 19.
The individual response rate for firms with a workforce of 5 or less is higher than for larger firms as shown in Table 1. As explained above, theses rates are higher that we expected, possibly as a result of inconsistent reporting.
Table 1: Response rate by firm size
| Size of Firm | Total Number of Individuals working at all Firms in the given size Category | Total Number of Respondents at all Firms in the given size Category | Response Rate |
|---|---|---|---|
| < 6 | 9,230 | 8,178 | 89% |
| 6 to 25 | 40,694 | 34,634 | 85% |
| >25 | 151,279 | 116,979 | 77% |
| Total | 201,203 | 159,791 | 79% |
- 20.
The size of firm in this table is determined by the total number of individuals working at the firm as provided by the firm.
Survey results
- 21.
In this section, we have set out graphs to represent the known responses to the diversity questions asked. The graphs show the percentage of each response for three different role groups. We have amalgamated the role categories in this way to keep the report simple. The data was provided to us, by the firms, in 13 different role categories.
- 22.
The three role groups shown in the report are 'Solicitor Partner or Equivalent', 'Solicitor and Other Lawyer' and 'Other Staff'. The full range of role categories and how these have been amalgamated into the three role groups is set out in Appendix 1.
- 23.
The number of individuals who provided a response has increased this year but the percentage of individuals who selected 'prefer not to say' has also increased. The percentages shown on the graphs are the number of responses as a percent of the total known responses. Although the 'prefer not to say' responses have been excluded from the graphs, the data has been provided in Appendix 3. Appendix 3 includes a table for each graph, showing the numerical information contained in the graphs along with the percentage of individuals who did not provide their information.
- 24.
For the ethnicity graph at Figure 5 below and the ethnicity table in Appendix 3, we have amalgamated the 18 different ethnicity categories which were available for selection into 5 groups: Asian, Black, Mixed, White and Other. The full range of ethnicity categories is set out in Appendix 2.
- 25.
The full data set is available.
Age
Figure 1: Age
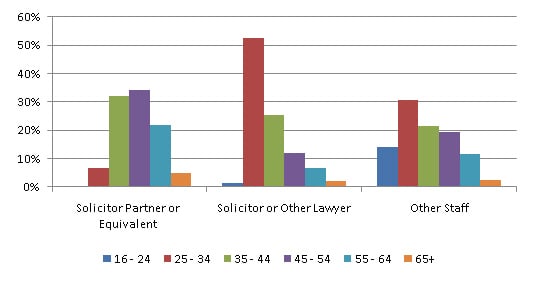
- 26.
Few individuals become a Solicitor Partner or Equivalent or a Solicitor or Other Lawyer before the age of 25 due to the education and training this requires, so differences would be expected in the age distributions above. 52% of Solicitors or Other Lawyers are between the ages of 25 and 34 but only 25% are between 35 and 44. In contrast there is an increase in the proportion of Solicitor Partner or Equivalents from the age of 35, indicating that many solicitors become a Solicitor Partner or Equivalent between the ages of 35 and 44.
Gender
Figure 2: Gender
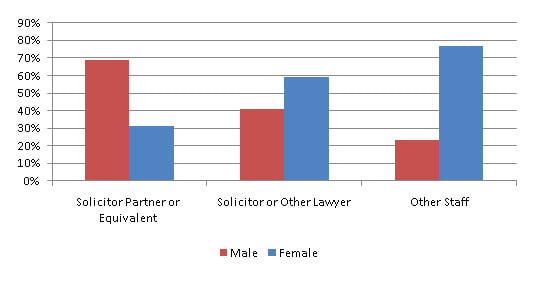
- 27.
A higher percentage of Solicitor Partner or Equivalent roles are held by males than females. However more individuals in the other two groups are female. More than 3 times more individuals in the Other Staff group are female.
Disability
Figure 3: Individuals with a disability according to the definition of the Equality Act and individuals whose day to day activities are limited because of health problem or disability.
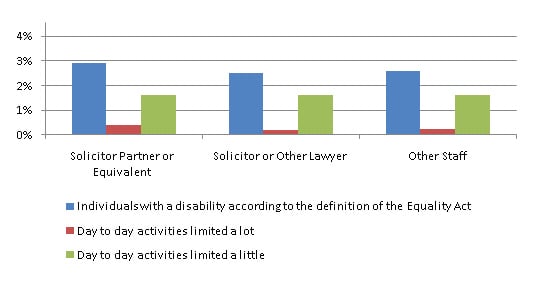
- 28.
Less than 3% of individuals reported that they have a disability according to the definition of the Equality Act. Similar proportions of individuals in each of the three groups reported that their day to day activities are limited.
Ethnicity
Figure 4: Ethnic group
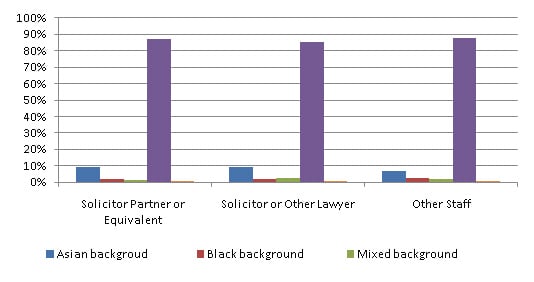
- 29.
It has been reported that 12.4% of the UK workforce is from an ethnic minority background.1 87.1% of the survey respondents who provided information on their ethnicity are from a white background while the remaining 12.9% are from an ethnic minority background. Across all three groups there is a higher proportion of Asian individuals among the Black or Minority Ethnic (BME) categories. There are small differences in the ethnic breakdown between the three groups, the highest proportion of BME individuals is 15% for the Solicitor or Other Lawyer group, as compared to 13% for the Solicitor Partner or Equivalent group and 12% for the Other Staff group.
Religion or belief
Figure 5: What is your religion or belief?
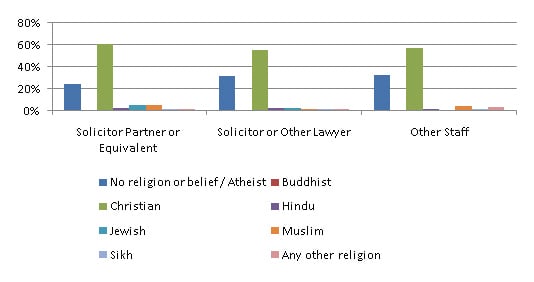
- 30.
Only 66% of individuals provided details of their religion or belief, this is one of the lowest response rates. The largest religious group for individuals in all three groups is Christian (60% for Solicitor Partner or Equivalent, 57% for Other Staff and 56% for Solicitor or Other Lawyer). The next largest group are those individuals who have declared themselves to have no religion or to be atheist (25%, 32% and 31% respectively).
Sexual Orientation
Figure 6: Sexual orientation
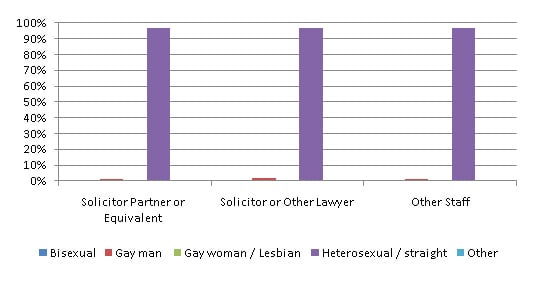
- 31.
97% of individuals who provided information about their sexual orientation are heterosexual and there was little difference between the three groups.
Socio economic background - education
Figure 7: Sexual orientation
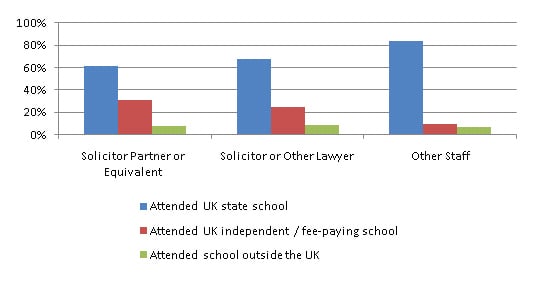
- 32.
The proportion of individuals attending a UK state school increases from the Solicitor Partner or Equivalent group to the Solicitor or Other Lawyer group to the Other Staff group. The proportion attending a UK independent/fee paying school decrease across the role groups.
Figure 8: University
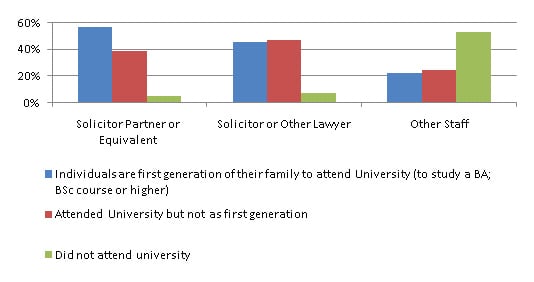
- 33.
A much higher proportion of the individuals in the Other Staff group did not attended University, in comparison to the other two groups. Of those individuals who went to University, a higher proportion of individuals in the Solicitor Partner or Equivalent group were part of the first generation of their family to do so, in comparison to the other two groups.
Caring responsibilities
Figure 9: Individuals with primary carer responsibilities for a child or children under 18.
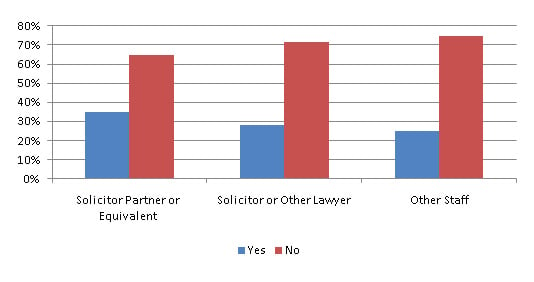
- 34.
A slightly higher proportion of individuals in the Solicitor Partner or Equivalent group are primary carers than those in the other two groups. This could be related to the varying age distributions of the role groups.
Figure 10: Individuals who give any help or support to family members, friends, neighbours or others because of either long-term physical or mental ill-health/ disability or problems related to old age

- 35.
The majority of individuals do not look after, or give any help or support to family members, friends, neighbours or others because of either long-term physical or mental ill-health/ disability or problems related to old age. Where individuals do provide this help or support it is fairly evenly distributed across the role groups.
Conclusions
- 36.
It is too early to identify any trends at this stage but we have compared the results to last year and although there was increased reporting of disability this year, from 2% to 3%, there is little change in the diversity profile across the groups for age, gender, ethnicity and religion.
- 37.
The most noticeable change was that although there was a 10% increase in the number of individuals responding this year, there was also an increase in the proportion of respondents who selected the 'prefer not to say' option for one or more of the questions. For the sexual orientation, religion, education and caring questions the individuals selecting 'prefer not to say' more than doubled this year. It may be that individuals reporting their data within their firm were more inclined to respond but less inclined to disclose their data.
- 38.
The lack of a diverse and representative profession is one of the current risks outlined in our updated Risk Outlook, Spring 2014. We have outlined why we see lack of a diverse and representative profession as a current risk, providing evidence of disparity of access, pay and progression between groups, including those with protected characteristics under the Equality Act.
- 39.
We will be expecting firms to consider the evidence they have gathered, identify the gaps and consider any actions they might need to take to mitigate the risk of not having a representative workforce.
- 40.
The Law Society are continuing to support firms in meeting Principle 9 and have recently published guidance for law firms, including a specific guide for small firms 'Diversity and Inclusion for law firms: the business case'.
- 41.
The workforce diversity data produced as a result of this exercise at a firm level and across the profession will provide a good evidential basis for identifying how we might address the risks presented by the lack of a diverse and representative profession. We hope this year that we can encourage more firms to see the benefits of diversity monitoring and that firms in turn will encourage and reassure more of their staff to respond.
Appendix 1: The role categories against which the diversity data was collected
In the graphs we have amalgamate the roles into Solicitor Partner or Equivalent, Solicitor or Other Lawyer and Other Staff. The table below sets out the role categories included in each group.
| Role Group | Role categories in the survey |
|---|---|
| Solicitor Partner or Equivalent | Solicitor (sole practitioner, partner, member or director) |
| Solicitor or Other Lawyer | Solicitor |
| Barrister | |
| Chartered Legal Executive/Legal Executive Fellow | |
| Licensed Conveyance | |
| Patent or Trade Mark Attorney | |
| Costs Lawyer | |
| Notary | |
| Other Staff | Other fee earning role |
| Role directly supporting a fee earner | |
| Managerial role | |
| IT / HR / other corporate services role | |
| Prefer not to say | Prefer not to say |
Appendix 2: Ethnicity categories in the survey
| Ethnic Group | Ethnicity categories in the survey |
|---|---|
| Asian background | Bangladeshi |
| Chinese | |
| Indian | |
| Pakistani | |
| Any other Asian background | |
| Black background | African |
| Caribbean | |
| Any other black background | |
| Mixed background | White & Asian |
| White & Black African | |
| White & Black Caribbean | |
| Any other mixed background | |
| White background | British (English / Welsh / Northern Irish / Scottish) |
| Irish | |
| Gypsy, Roma or Irish Traveller | |
| Any other white background | |
| Other Ethnic background | Arab |
| Any other ethnic background |
Appendix 3: Tables showing further information for each graph
The tables below show the detailed information of each graph and the information is split by the 3 role groups. For the majority of tables, the first two columns show the total number of individuals working at the firms and the total of individuals who provided a known response. A 'known response' is where an individual has selected one of the diversity categories provided. The final 3 columns in these tables show the percentage (of the total number of individuals working at the firms) for the known responses, for those who selected prefer not to say and those who did not respond at all to the question. These 3 columns will add up to 100% and relate to the total individuals working at the firms. The columns in the middle of these tables, showing the diversity categories for each question, will also add up to 100% and relate to all known responses.
The two tables reflecting the disability questions and the table reflecting the question about help and support given to others are set out differently. This is because there was a large number of individuals answering these questions who did not respond. For these tables we have set out the total number of individuals working at the firm in the first columns. The remaining columns are expressed as a percentage of the total number of individuals working at a firm and as such will add up to 100%. NB Occasionally the percentages will appear not to add up to 100%, this is due to rounding.
Age
| Role | Total Individuals | Total Known Responses | 16 - 24 | 25 - 34 | 35 - 44 | 45 - 54 | 55 - 64 | 65+ | Total Known Responses | Prefer not to say | No Response |
|---|---|---|---|---|---|---|---|---|---|---|---|
| Solicitor Partner or Equivalent | 30110 | 25204 | 0% | 7% | 32% | 34% | 22% | 5% | 84% | 3% | 13% |
| Solicitor or Other Lawyer | 48112 | 40329 | 1% | 52% | 25% | 12% | 7% | 2% | 84% | 3% | 13% |
| Other Staff | 105214 | 86004 | 14% | 31% | 21% | 20% | 12% | 3% | 82% | 3% | 15% |
| Prefer Not to Say | 17767 | 3965 | 17% | 26% | 20% | 18% | 14% | 4% | 22% | 25% | 53% |
Gender
| Role | Total Individuals | Total Known Responses | Female | Male | Total Known Responses | Prefer not to say | No Response |
|---|---|---|---|---|---|---|---|
| Solicitor Partner or Equivalent | 30110 | 25695 | 31% | 69% | 85% | 2% | 12% |
| Solicitor or Other Lawyer | 48112 | 41054 | 59% | 41% | 85% | 2% | 13% |
| Other Staff | 105214 | 88248 | 77% | 23% | 84% | 2% | 15% |
| Prefer Not to Say | 17767 | 4794 | 73% | 27% | 27% | 21% | 52% |
Individuals with a disability according to the definition of the Equality Act
| Role | Total Individuals | Individuals with a disability according to the definition of the Equality Act | Prefer not to say | No Response |
|---|---|---|---|---|
| Solicitor Partner or Equivalent | 30110 | 3% | 7% | 90% |
| Solicitor or Other Lawyer | 48112 | 3% | 7% | 90% |
| Other Staff | 105214 | 3% | 6% | 91% |
| Prefer Not to Say | 17767 | 2% | 23% | 76% |
Individuals whose activities are limited because of a health problem or disability which has lasted, or is expected to last, at least 12 months
| Role | Total Individuals | Day to day activities limited a lot | Day to day activities limited a little | No | Prefer not to say | No Response |
|---|---|---|---|---|---|---|
| Solicitor Partner or Equivalent | 30110 | 0% | 2% | 44% | 5% | 49% |
| Solicitor or Other Lawyer | 48112 | 0% | 2% | 48% | 5% | 45% |
| Other Staff | 105214 | 0% | 2% | 47% | 4% | 47% |
| Prefer Not to Say | 17767 | 0% | 1% | 16% | 23% | 60% |
Ethnicity
| Role | Total Individuals | Total Known Responses | Asian background | Black background | Mixed background | White background | Other Ethnic Background | Total Known Responses | Prefer not to say | No Response |
|---|---|---|---|---|---|---|---|---|---|---|
| Solicitor Partner or Equivalent | 30110 | 24204 | 9% | 2% | 1% | 87% | 1% | 80% | 6% | 14% |
| Solicitor or Other Lawyer | 48112 | 38716 | 10% | 2% | 2% | 85% | 1% | 80% | 5% | 15% |
| Other Staff | 105214 | 83621 | 7% | 2% | 2% | 88% | 1% | 79% | 4% | 17% |
| Prefer Not to Say | 17767 | 4686 | 5% | 2% | 2% | 88% | 1% | 26% | 21% | 53% |
Religion or belief
| Role | Total Individuals | Total Known Responses | No religion or belief / Atheist | Buddhist | Christian | Hindu | Jewish | Muslim | Sikh | Any other religion | Total Known Responses | Prefer not to say | No Response |
|---|---|---|---|---|---|---|---|---|---|---|---|---|---|
| Solicitor Partner or Equivalent | 30110 | 21052 | 25% | 1% | 60% | 2% | 5% | 5% | 2% | 1% | 59% | 13% | 27% |
| Solicitor or Other Lawyer | 48112 | 33896 | 31% | 1% | 56% | 2% | 3% | 2% | 2% | 1% | 63% | 12% | 26% |
| Other Staff | 105214 | 73338 | 32% | 1% | 57% | 2% | 1% | 4% | 1% | 3% | 63% | 11% | 27% |
| Prefer Not to Say | 17767 | 4123 | 33% | 1% | 56% | 2% | 1% | 3% | 1% | 3% | 0% | 24% | 76% |
Sexual orientation
| Role | Total Individuals | Total Known Responses | Bisexual | Gay woman / Lesbian | Heterosexual / straight | Other | Total Known Responses | Prefer not to say | Prefer not to say | No Response |
|---|---|---|---|---|---|---|---|---|---|---|
| Solicitor Partner or Equivalent | 30110 | 21856 | 1% | 1% | 1% | 97% | 1% | 67% | 11% | 21% |
| Solicitor or Other Lawyer | 48112 | 35719 | 1% | 2% | 1% | 96% | 0% | 70% | 9% | 21% |
| Other Staff | 105214 | 77242 | 1% | 1% | 0% | 97% | 1% | 68% | 8% | 24% |
| Prefer Not to Say | 17767 | 4327 | 1% | 1% | 1% | 96% | 1% | 21% | 23% | 55% |
School Education
| Role | Total Individuals | Total Known Responses | Attended UK state school | Attended UK independent / fee-paying school | Attended school outside the UK | Total Known Responses | Prefer not to say | No Response |
|---|---|---|---|---|---|---|---|---|
| Solicitor Partner or Equivalent | 30110 | 21950 | 62% | 31% | 8% | 73% | 9% | 18% |
| Solicitor or Other Lawyer | 48112 | 35240 | 67% | 24% | 8% | 73% | 8% | 19% |
| Other Staff | 105214 | 77053 | 84% | 9% | 7% | 73% | 6% | 20% |
| Prefer Not to Say | 17767 | 3890 | 86% | 9% | 6% | 22% | 21% | 57% |
University Education
| Role | Total Individuals | Total Known Responses | Individuals are first generation of their family to attend University (to study a BA; BSc course or higher) | Attended University but not as first generation | Did not attend university | Total Known Responses | Prefer not to say | No Response |
|---|---|---|---|---|---|---|---|---|
| Solicitor Partner or Equivalent | 30110 | 20862 | 57% | 39% | 5% | 69% | 9% | 21% |
| Solicitor or Other Lawyer | 48112 | 33854 | 45% | 47% | 7% | 70% | 8% | 21% |
| Other Staff | 105214 | 71881 | 22% | 24% | 53% | 68% | 8% | 24% |
| Prefer Not to Say | 17767 | 3622 | 20% | 25% | 55% | 20% | 24% | 55% |
Primary carer for a child or children under 18
| Role | Total Individuals | Total Known Responses | Yes | No | Total Known Responses | Prefer not to say | No Response |
|---|---|---|---|---|---|---|---|
| Solicitor Partner or Equivalent | 30110 | 20892 | 35% | 65% | 69% | 9% | 21% |
| Solicitor or Other Lawyer | 48112 | 33563 | 28% | 72% | 70% | 8% | 22% |
| Other Staff | 105214 | 33563 | 25% | 75% | 70% | 7% | 23% |
| Prefer Not to Say | 17767 | 3974 | 25% | 75% | 22% | 23% | 54% |
Individuals who give any help or support to family members, friends, neighbours or others because of either long-term physical or mental ill-health / disability or problems related to old age.
| Role | Total Individuals | 1-19 hours a week | 20-49 hours a week | 50 or more hours a week | Prefer not to say | No Response |
|---|---|---|---|---|---|---|
| Solicitor Partner or Equivalent | 30110 | 12% | 1% | 0% | 12% | 75% |
| Solicitor or Other Lawyer | 48112 | 9% | 1% | 0% | 10% | 79% |
| Other Staff | 105214 | 10% | 1% | 1% | 9% | 79% |
| Prefer Not to Say | 17767 | 4% | 1% | 0% | 23% | 72% |